
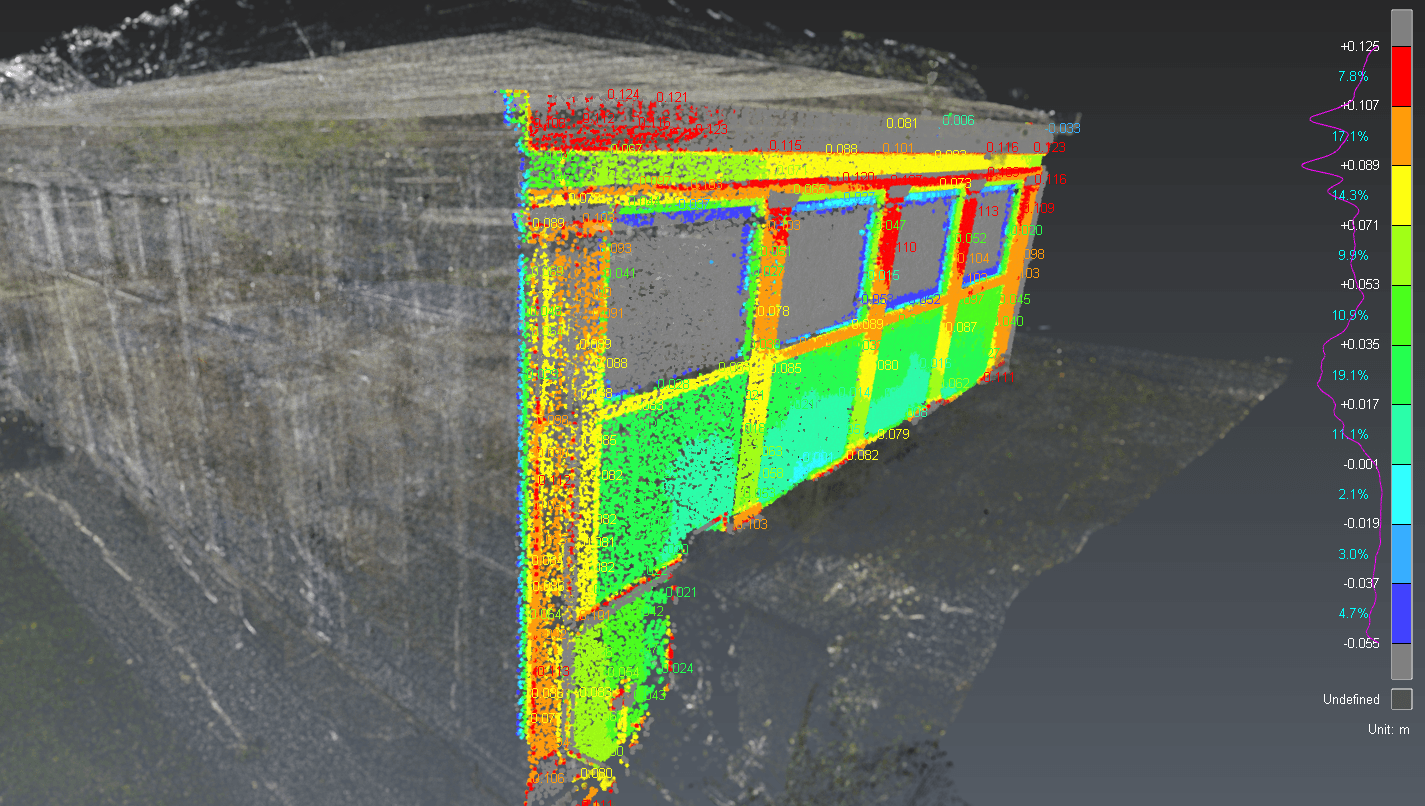

A color map can show that an installed condition differs from a model. The project team still needs the right technical context to determine what that difference means.
Construction deviation analysis compares measured field conditions against design, fabrication, coordinated, or previously captured geometry. The analysis can show where the physical installation differs from the selected reference and quantify the geometric difference.
OAR captures the physical condition, establishes the spatial relationship between datasets, performs the comparison, and communicates the result in a usable format. The professionals responsible for design, engineering, fabrication, construction, or acceptance determine whether a measured difference is significant and what action should follow.
That separation gives each project team a clearer way to use the evidence and protects the distinction between measurement and professional judgment.
What We’ll Cover
What Construction Deviation Analysis Measures
A typical construction deviation analysis begins with two datasets:
- Measured field conditions, usually represented by a registered point cloud captured through 3D Laser Scanning.
- Reference geometry, such as a design model, coordinated trade model, fabrication model, IFC file, earlier scan, or another project-defined baseline.
Once the datasets have an appropriate spatial relationship, software can calculate the distance between measured points or surfaces and the reference geometry. Teams can review those differences through color-mapped views, sections, measurement callouts, annotated screenshots, reports, or interactive web environments.
The value comes from making dense 3D information easier to evaluate. Instead of relying on isolated measurements, a project team can review the distribution and pattern of geometric differences across a component, assembly, or system.
The insights gained through construction deviation analysis can significantly enhance project management strategies.
The Workflow Starts With the Project Question
The capture and analysis plan should begin with the condition the project team needs to understand. Common questions include:
- How does installed steel geometry compare with the selected reference model?
- Are MEP sleeves located where the coordinated design expected them?
- How does a fabricated component compare with its intended geometry?
- What changed between two defined capture dates?
- Where does the current field condition differ from an earlier baseline?
Each question may require a different capture strategy, reference, alignment method, analysis setting, and deliverable. A technically accurate point cloud can still produce an incomplete analysis when the downstream question is unclear.
This follows a principle we use: define the data strategy and the decision pathway before collecting or structuring project information. The deliverable should preserve enough context for the next person to use it.
Step 1: Capture the Relevant Field Condition
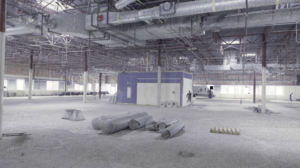
Terrestrial laser scanning can collect dense three-dimensional measurements of visible surfaces and create a point cloud representing the field condition at the time of capture.
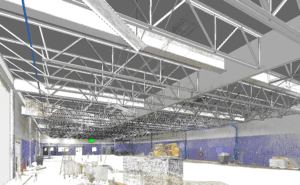
The field team needs sufficient visibility of the surfaces that matter to the comparison. Scanner position, line of sight, occlusion, access, surface behavior, and project control all affect the usefulness of the dataset. An overhead MEP verification scope, for example, may require positions selected to improve visibility around ductwork, piping, conduit, and sprinkler systems. A structural scope may require different coverage.
Field capture should follow the analysis need.
Step 2: Establish the Spatial Relationship
Before two datasets can be compared, their spatial relationship needs to be established. The workflow may use project survey control, shared coordinates, control points, reference geometry, localized alignment, or another documented method.
The method should match the project question. A detailed heatmap can appear precise while answering the wrong question when the scan and reference geometry have been related incorrectly.
Step 3: Define the Reference
Every deviation is measured from a selected baseline. Possible references include:
- design intent
- coordinated BIM
- fabrication geometry
- an earlier scan
- an existing-conditions model
- another project-defined baseline
The analysis should state the reference clearly because each baseline answers a different question. A comparison with design intent differs from a comparison with an earlier as-built condition. A design model also may not contain the fabrication or engineering criteria used for final acceptance.
Implementing construction deviation analysis ensures that all project phases are consistently monitored for compliance.
Step 4: Compare the Geometry
With the datasets prepared, the measured field condition can be compared with the reference geometry. Depending on the scope, the output may communicate direction, magnitude, local areas of variation, broader patterns across a component, sections through selected locations, or change between capture dates.
Scan-vs-BIM research has applied this basic comparison to as-built verification, MEP sleeve locations, and dimensional inspection of concrete elements. The appropriate method and required accuracy still depend on the project use case.
Step 5: Deliver Results for the Responsible Team
Deviation data is easier to review when the deliverable matches the decision and the people responsible for making it. Depending on the scope, OAR can provide:
- color-mapped deviation views
- annotated screenshots and measurement callouts
- sections and comparison views
- deviation reports
- aligned point clouds
- interactive web-based results
- methodology notes that preserve the comparison context
This step connects 3D Laser Scanning with OAR’s broader Digital Delivery & Implementation approach. Project information should remain tied to the physical condition, the selected reference, and the downstream decision it supports.
What Deviation Analysis Can Show
Location of a Difference: The analysis can identify areas where measured geometry sits differently from the selected baseline.
Magnitude and Direction: The output can quantify the geometric difference and, when the workflow supports it, communicate its direction relative to the comparison surface or model.
With construction deviation analysis, teams can better manage construction risks and ensure quality assurance.
Local Variation and Broader Patterns: A color map or section can help distinguish an isolated area from a pattern that continues across a larger component or system.
Change Between Defined Capture Dates: Repeat capture can provide a spatial record of change between specific stages or dates when the datasets were collected and compared using an appropriate method.
Areas for Further Review: Deviation outputs can direct the contractor, designer, fabricator, engineer, or owner representative to locations that warrant closer evaluation.
Through construction deviation analysis, discrepancies are effectively highlighted, prompting timely corrections.
What Requires Professional Interpretation
A geometric comparison does not determine the following on its own:
- structural adequacy or significance
- code compliance
- whether a governing tolerance has been satisfied
- whether an installation should be accepted
- whether corrective work is required
- the cause of a measured difference
Those conclusions may depend on engineering criteria, specifications, fabrication standards, contractual requirements, loading conditions, construction means and methods, and other information outside the point cloud.
Construction deviation analysis provides the framework needed for effective project audits and assessments.
OAR documents the measured condition and the methodology used to create the deviation output. The responsible project professionals interpret the result for the project.
Where Construction Deviation Analysis Can Be Applied
MEP Installation Verification
Installed piping, ductwork, conduit, sleeves, sprinkler systems, and other MEP components can be captured and compared with appropriate coordinated or design geometry. For BIM and VDC teams, this can provide measured information before later work depends on the installed condition.
Effective construction deviation analysis can lead to improved resource management and reduced costs.
Structural Steel
Steel components can be captured and compared with design or fabrication geometry. OAR’s existing article on steel deviation analysis covers this material-specific application in more detail.
Ultimately, construction deviation analysis plays a crucial role in achieving project goals and objectives.
Fabricated Components
A fabricated assembly can be scanned at defined stages and compared with a selected digital reference. The resulting data can support review by the fabricator, contractor, engineer, or project team.
This method of construction deviation analysis not only verifies compliance but also enhances collaboration among project stakeholders.
Concrete and Structural Elements
Research has applied Scan-vs-BIM methods to dimensional inspection of beams, slabs, columns, and walls, including measurements related to dimensions, verticality, levelness, flatness, and position. Project requirements determine whether a particular method and dataset are suitable.
Construction Progress and Change Over Time
Repeat capture can document what physically exists at different stages. Comparisons may then show measured change across time or relative to a defined project reference.
OAR connects 3D Laser Scanning, BIM Coordination & Virtual Construction, and Digital Delivery & Implementation to build verification workflows around the condition your project team needs to evaluate.